
Appearance
Features
Everything Cota does grows from one reference-grade ITU-R BS.1770 loudness engine — the same implementation the Orbit app uses. What changes is how you see that measurement: a contour gauge, a spectral terrain, a 3D spatial view, a full dashboard, and a remote view you can pull up on any screen. This page walks through each one.
Cota is in Early Access
Cota is currently in beta (build 1.0.0-beta.4). The features below are shipping, but details may still change before the full release. See the FAQ for status.
Gauge
The Gauge is the heart of Cota, and the one thing that is never gated — it works identically in both Cota and Cota Lite.
On a single 300° contour gauge you get:
- Integrated LUFS — your programme loudness over the whole measurement.
- Short-term LUFS — a 3-second sliding window.
- Momentary LUFS — a 400 ms window for catching transients.
- Loudness range (LRA) — the spread between the quiet and loud parts of your material.
- True peak — inter-sample peak in dBTP, so you catch overs that a sample peak meter misses.
Set a delivery target and the Gauge shows an over-target warning the moment you cross it, so you know at a glance whether a mix is inside spec.
Screenshot: the Cota Gauge — integrated, short-term and momentary LUFS with LRA and true peak on the 300° contour gauge, with an over-target warning
Spectral terrain
Cota's spectral terrain is a real-time spectral analyser — a live picture of how energy is distributed across the frequency spectrum. It comes in four visual styles, so you can pick the one that reads best for the work in front of you:
- Aurora — smooth, flowing bands of colour for an at-a-glance sense of spectral balance.
- Topo — a contour-map style that emphasises the shape and ridges of the spectrum.
- Bars — a classic analyser bar layout when you want precise, discrete frequency readings.
- Neon — a high-contrast style tuned for dim rooms and quick glances.
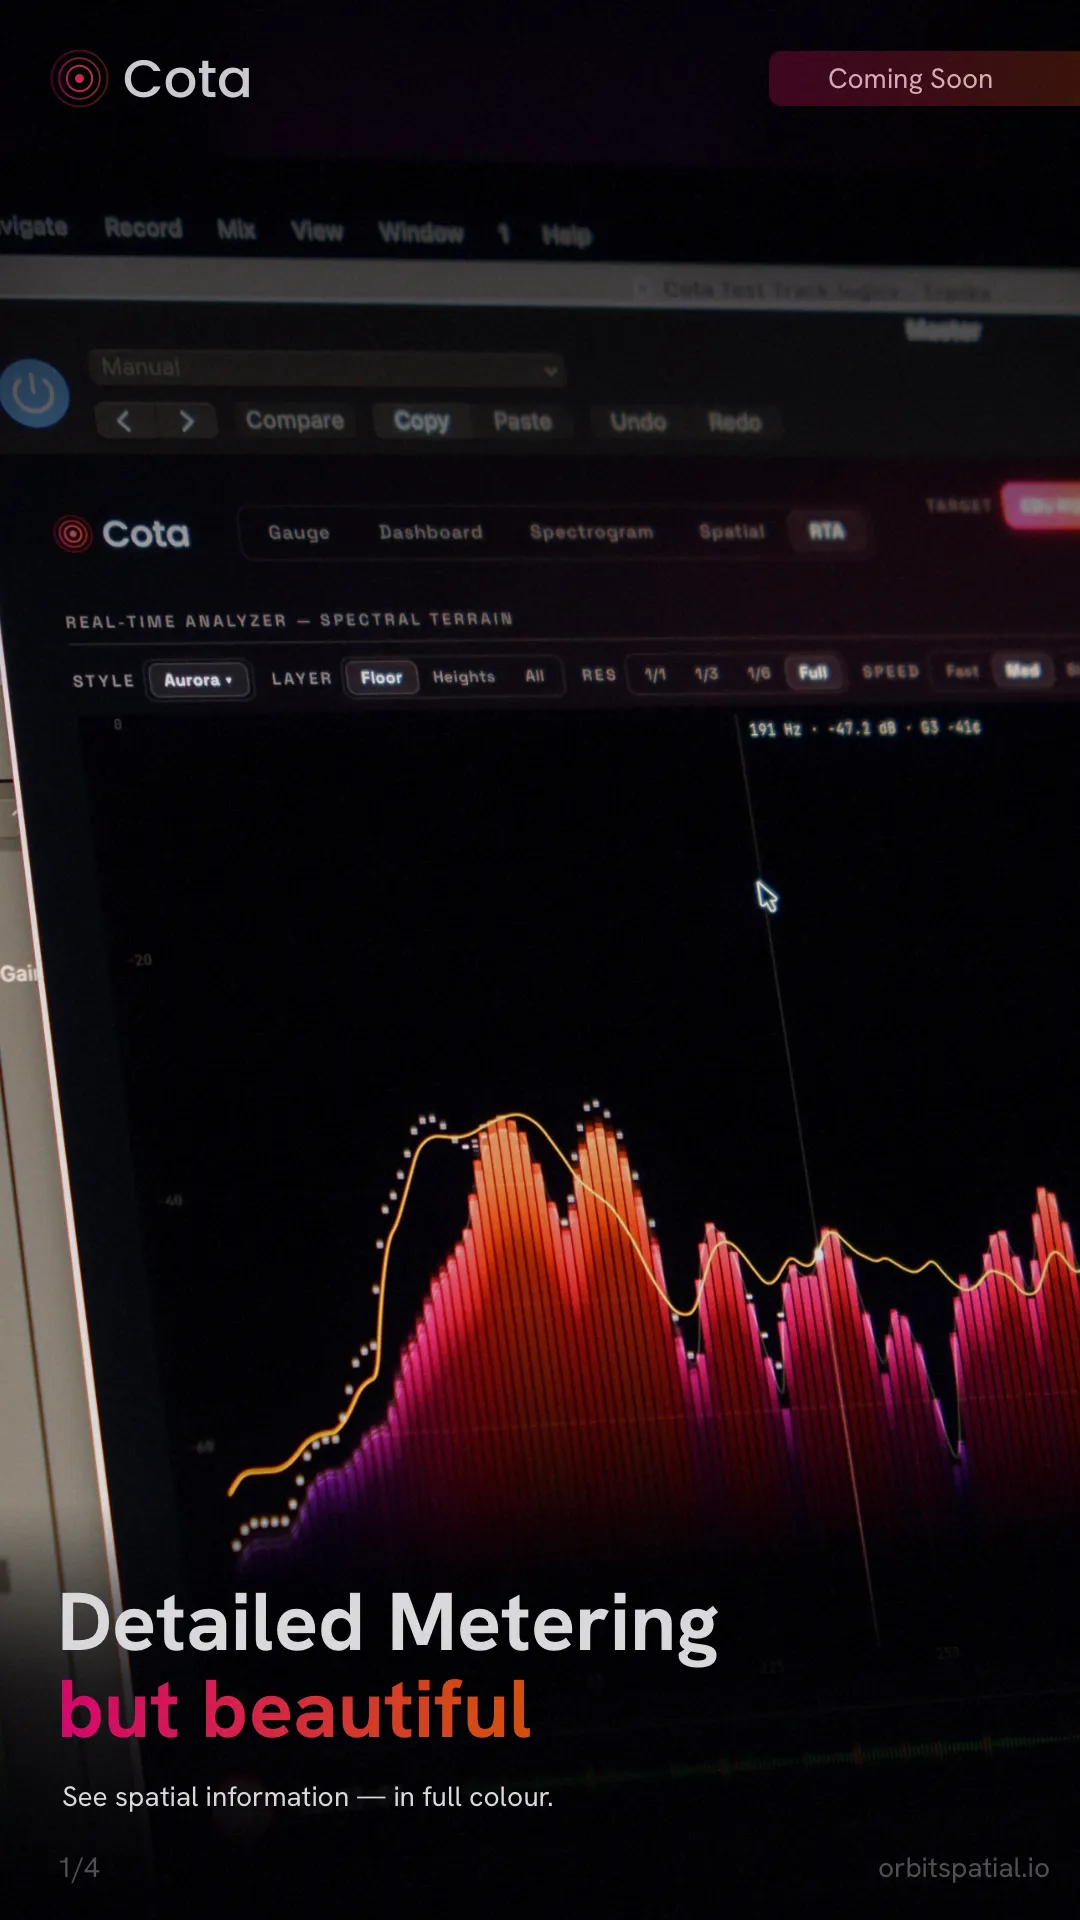
They are four looks at the same measurement — switching styles never changes the underlying analysis, only how you read it.
Spatial
The Spatial view gives you 3D spatial metering from stereo (2.0) all the way up to 9.1.6. Rather than a flat row of channel meters, it shows you where energy sits in the room, so you can see the balance across your bed and height channels while you mix in surround or Dolby Atmos.
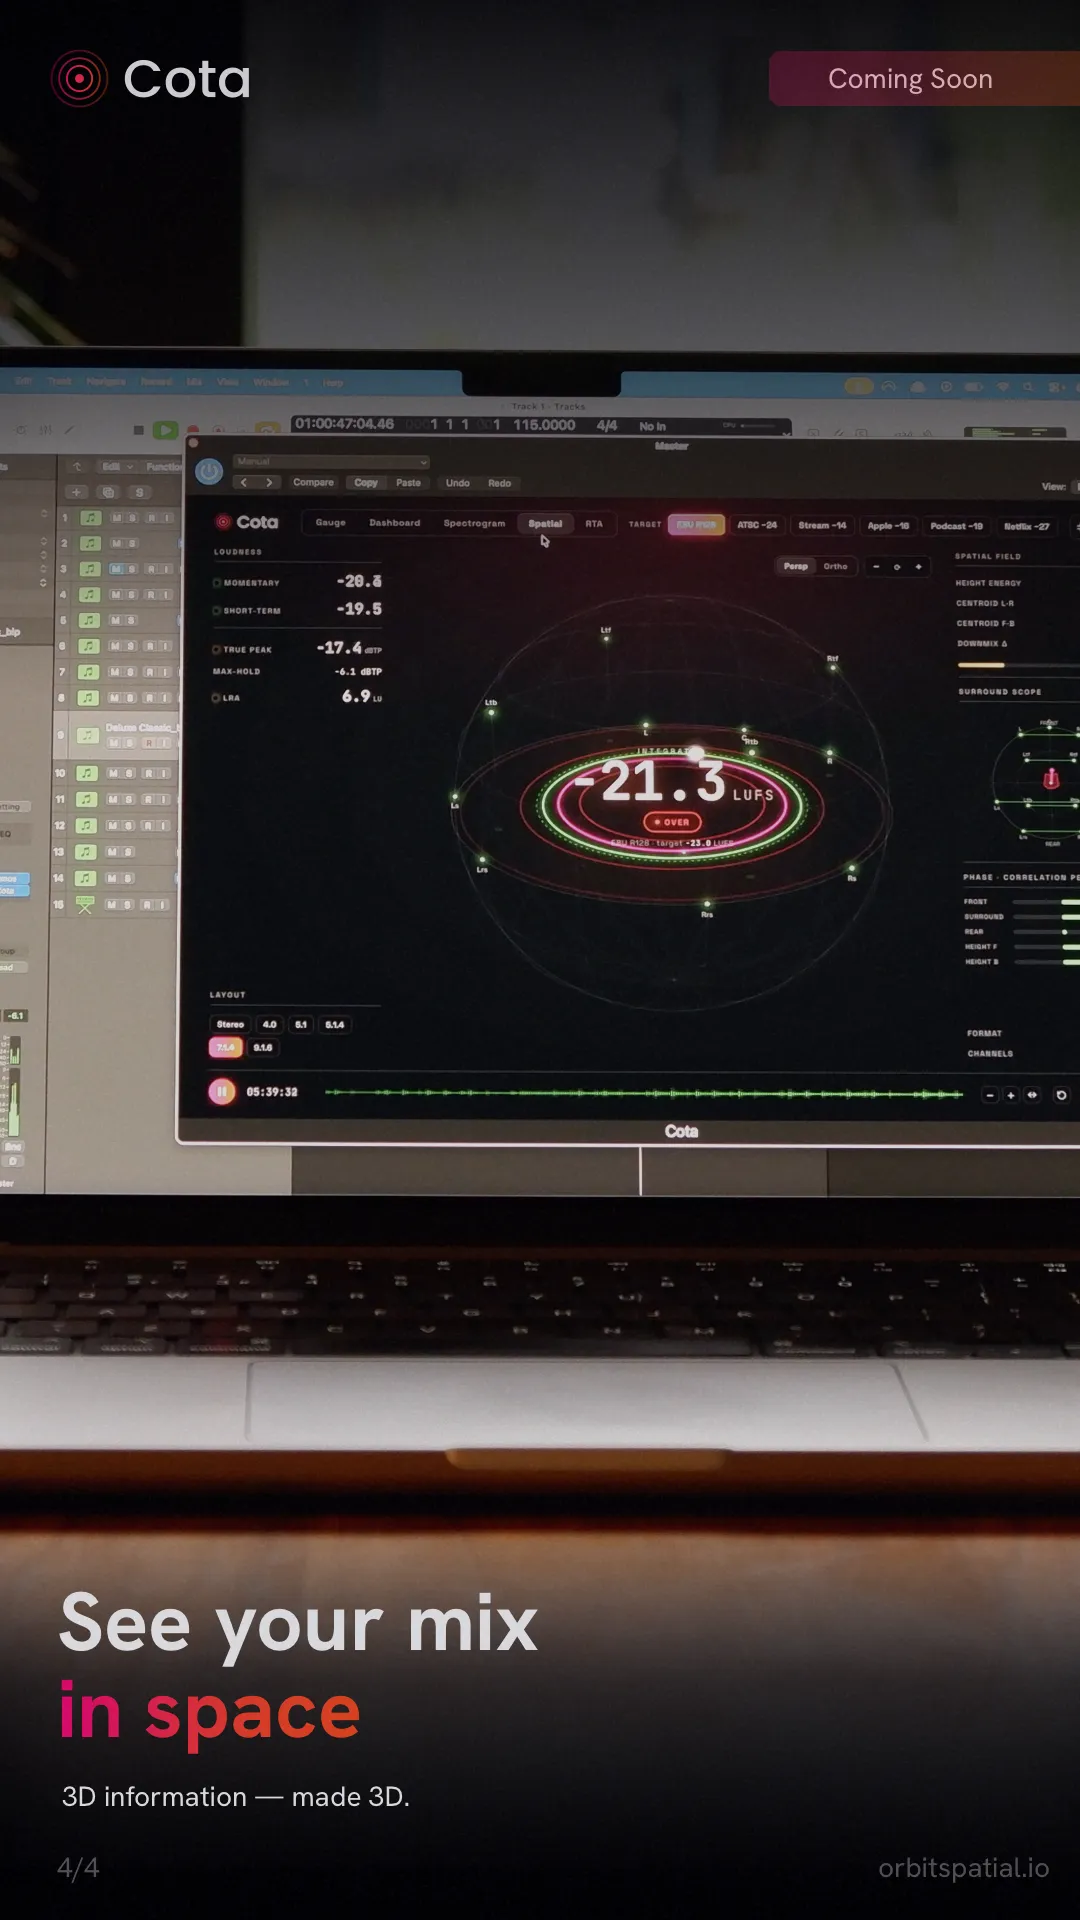
This is where Cota earns the "spatial audio analyser" name — it is built for professionals mixing in stereo and Atmos alike, in Reaper, Logic, Ableton, or wherever they work.
Dashboard
When you want everything at once, the Dashboard puts the full picture on a single screen:
- the Gauge,
- loudness history over time,
- a spectrogram,
- a goniometer for stereo/phase correlation, and
- per-channel true peak.
It's the view to leave open across a session — one screen that answers "is this mix compliant, balanced and phase-safe?" without switching tabs.
Screenshot: the Cota Dashboard — gauge, loudness history, spectrogram, goniometer and per-channel true peak on one screen
Remote view
The remote view serves Cota's live meters over your local network to any phone, tablet or browser — no app to install on the second device. Open the address in a browser on the same LAN and that screen becomes a monitoring station.
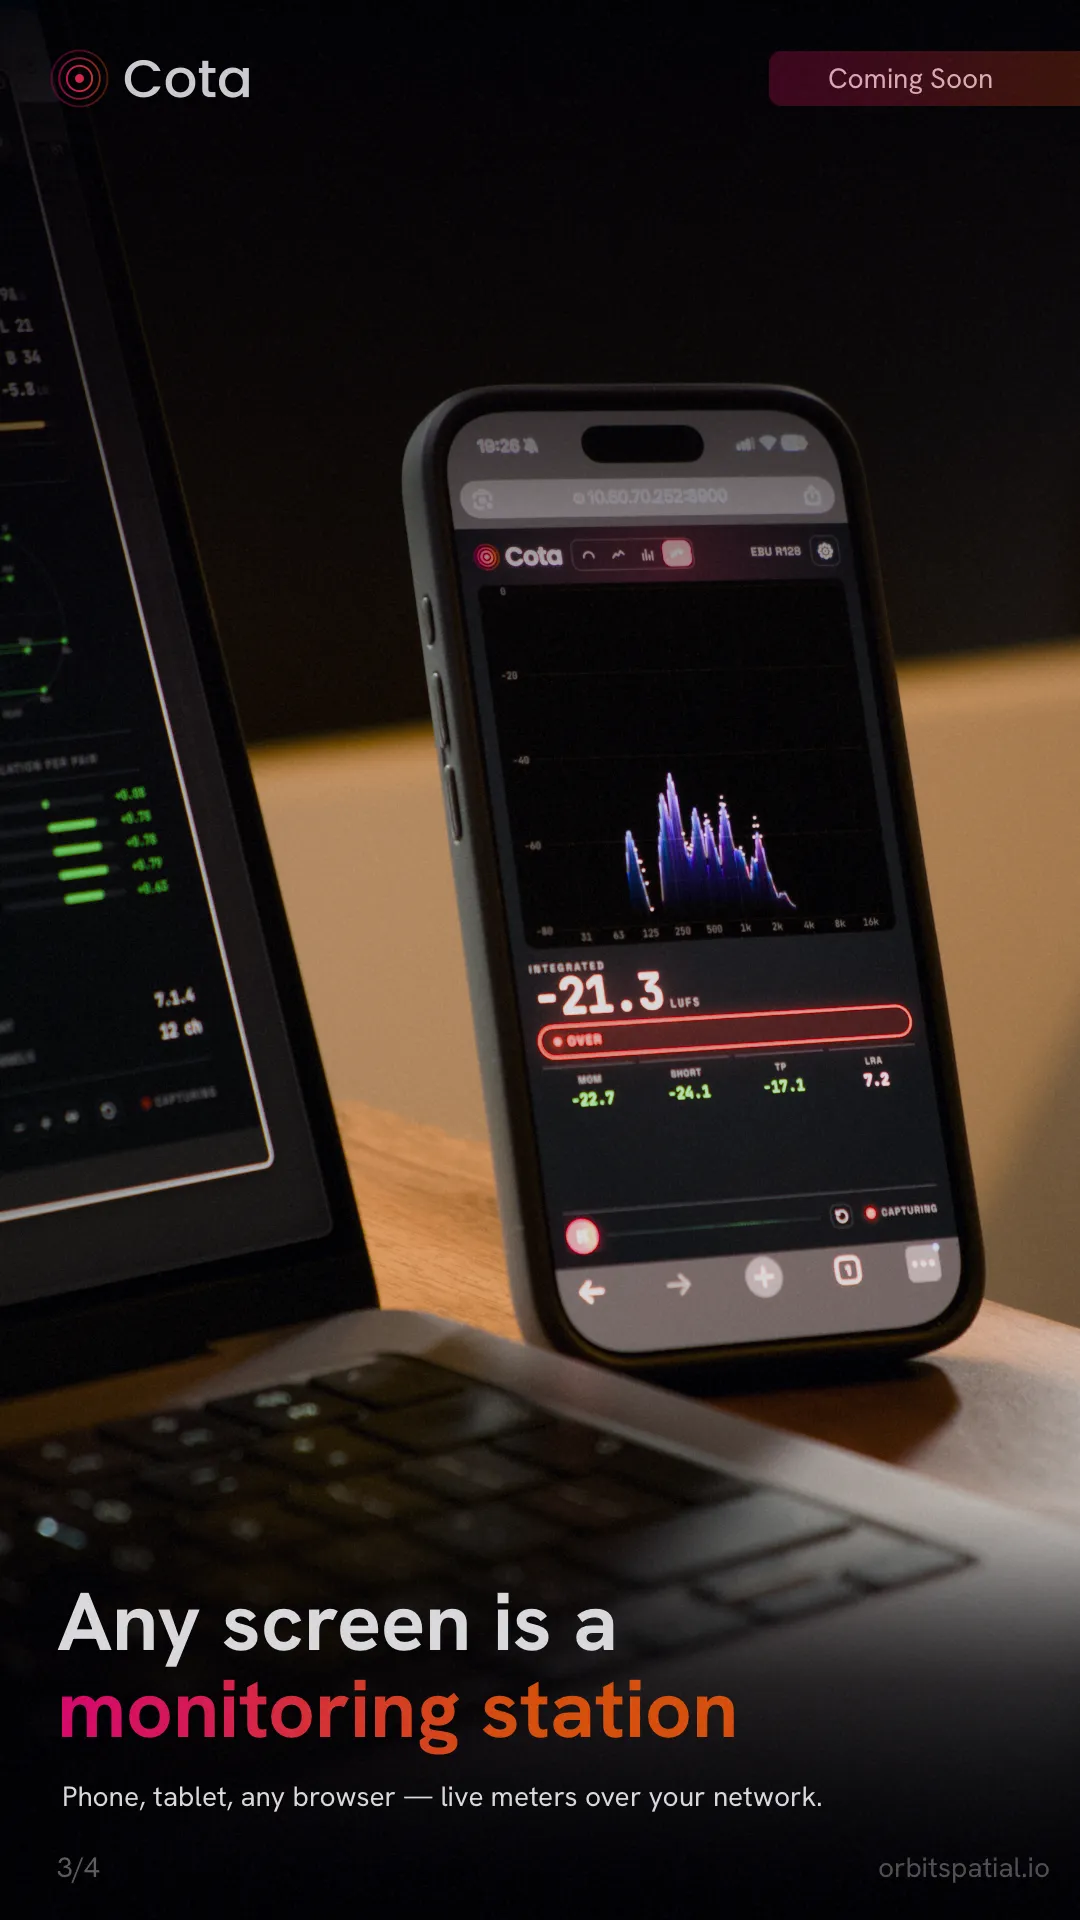
It's ideal for keeping a big, glanceable loudness readout on a tablet by the console, or checking levels from across the room while you work.
Plugin + standalone
Cota is the same engine wherever you run it:
- As a plugin — CLAP and VST3 everywhere, plus AU on macOS — so it drops straight into your DAW. Meter a bus, a master, or an individual track without leaving the session.
- As a standalone app — meter a WAV file or a live audio input without opening a DAW at all. Handy for quick compliance checks on a delivery, or for metering hardware coming in.
Same engine, either way
The measurement is identical whether you run Cota as a plugin or standalone — there's no "plugin-grade" versus "app-grade" accuracy. Pick whichever fits your workflow.
Report export
When a mix needs to be signed off, Cota produces a shareable record:
- an A4 PDF compliance report — your measured loudness against the target, ready to attach to a delivery, and
- a CSV history — the underlying time-series data for your own archiving or analysis.
Together they give you proof of compliance you can hand to a client or a broadcaster, not just a number on screen.
Where next
- Cota vs Cota Lite — which of these features are in each edition.
- Requirements & Formats — platforms, plugin formats and accuracy figures.
- FAQ — beta status, pricing and common questions.